Lesson 8
Scaling the Outputs
8.1: Notice and Wonder: Arch You Glad to See Me? (5 minutes)
Warm-up
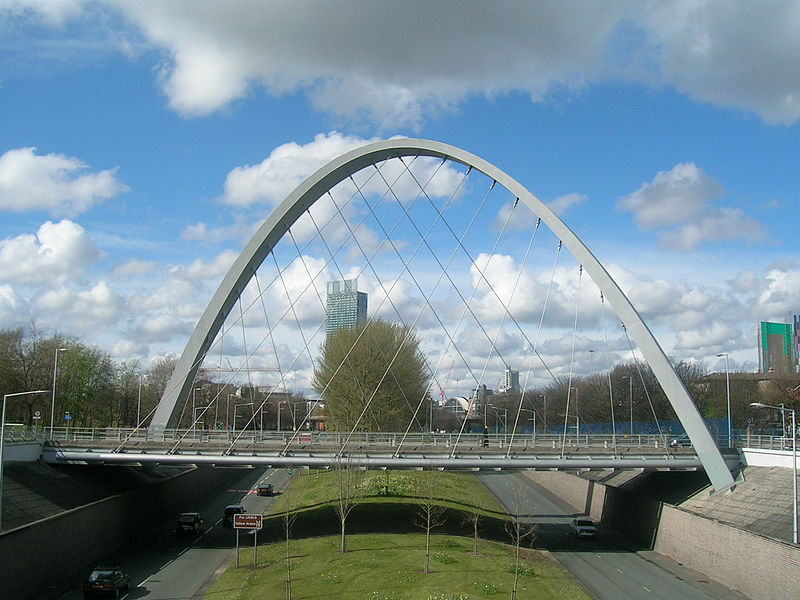
The purpose of this warm-up is to consider the shape of a parabola in the world and recall relevant vocabulary about 2nd degree polynomials, which will be useful when students model the image with a transformed quadratic function in the next activity. Consider replacing the image with a local parabolic arch-shaped landmark for this warm-up and the activity that follows to increase student interest. While students may notice and wonder many things about these images, the general shape of the arch is the important discussion point.
By engaging with the image of the arch to first become familiar with a context and the mathematics that might be involved, students are making sense of problems (MP1).
Launch
Display the image for all to see. Ask students to think of at least one thing they notice and at least one thing they wonder. Give students 1 minute of quiet think time, and then 1 minute to discuss the things they notice with their partner, followed by a whole-class discussion.
Student Facing
What do you notice? What do you wonder?
Student Response
For access, consult one of our IM Certified Partners.
Activity Synthesis
Ask students to share the things they noticed and wondered. Record and display their responses for all to see. If possible, record the relevant reasoning on or near the image. After all responses have been recorded without commentary or editing, ask students, “Is there anything on this list that you are wondering about now?” Encourage students to respectfully disagree, ask for clarification, or point out contradicting information.
If the parabolic shape of the arch does not come up during the conversation, ask students to discuss this idea along with any relevant vocabulary, such as vertex and horizontal intercepts.
8.2: The Hulme Arch Bridge (15 minutes)
Activity
The goal of this activity is for students to explore how multiplying the output of a function by a scale factor affects the shape of its graph. This activity builds on what students learned previously about the shape of polynomials and the relationship between zeros and factors. Students are also building skills that will help them in mathematical modeling (MP4). While they don’t decide which model to use, students do have an opportunity to transform a function to better fit a given shape.
Monitor for students who identify the scale factor in different ways, such as guess and check or identifying what to multiply the vertex of the parabola by to change from 676 to 25, to share during the whole-class discussion.
Launch
Display the graph with the overlaid axes and grid for all to see throughout the activity. After 5 minutes of work time, pause the class and invite students to share how they labeled the three marked coordinates and what the corresponding points are on the graph of \(H\). Encourage students to use mathematically precise language, such as vertex, zero, and intercept.
Design Principle(s): Support sense-making
Supports accessibility for: Language; Conceptual processing
Student Facing
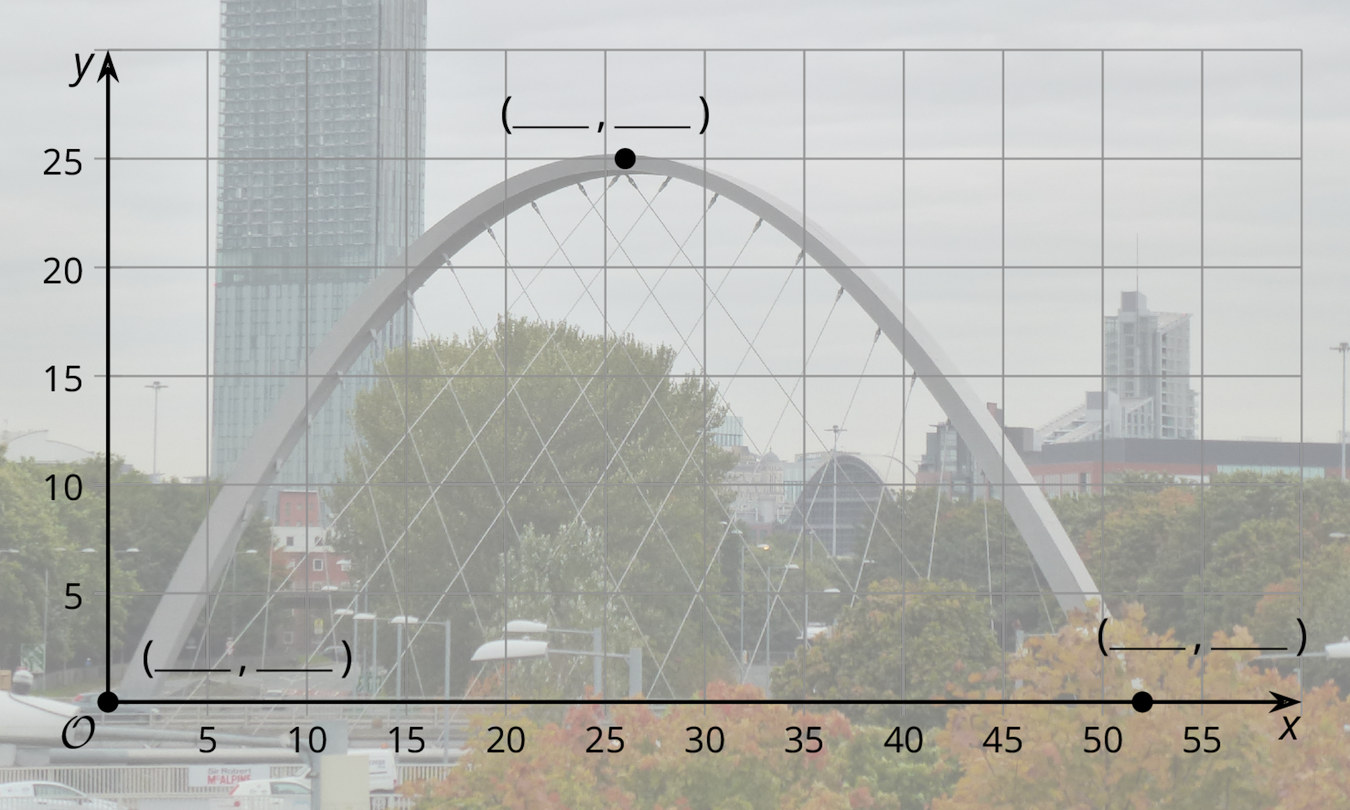
The Hulme Arch Bridge in Manchester, England is shaped like a parabola. The ends of the arch are 52 meters apart, and it is 25 meters high.
- Use the description to help you label the 3 coordinates on the graph.
- Han wants to model the shape of the arch with the graph of a function, and he chooses \(H(x) = x(52-x)\), where \(H(x)\) is the height in meters above a point \(x\) meters along the base of the arch from the left end.
- For the \(x\)-coordinates of the three points, what are the corresponding points on the graph of \(H\)?
- What aspects of the shape does Han’s function model well, and what parts does it not model well?
- Compare the height of Han’s graph with the height of the Hulme Arch Bridge. How can you change the outputs of \(H\) to make it fit better? What would the revised version of \(H(x)\) be?
Student Response
For access, consult one of our IM Certified Partners.
Activity Synthesis
Select 2–3 students to share what aspects of the shape they think Han’s function does and does not model well, recording responses for all to see next to the displayed graph. Invite previously selected students to share their responses comparing the height of Han’s graph and the height of the bridge, starting with students who used a guess and check method and ending with students who calculated a scale factor of \(\frac{25}{676} \approx 0.037\) since \(676 \boldcdot \frac{25}{676}=25\).
Conclude the discussion by telling students that the value 0.037 is often called a scale factor. In this instance, the scale factor compressed the graph vertically by a factor of 0.037 toward the \(x\)-axis. The only points that didn't move were those already on the \(x\)-axis, which were the two horizontal intercepts. Had the factor been a number greater than 1, we would say that the graph was stretched vertically away from the \(x\)-axis.
8.3: Feed the Dog (15 minutes)
Activity
Building on the work done in the previous activity, students now consider two possible function types for modeling a given data set. Students begin by creating a line of best fit for the data and identify what the linear function does and does not model well. Since the shape of the data shows a downward trend, students then consider a radical function to model the data and use graphing technology to identify an appropriate scale factor to use with a given expression. In this activity, students are building skills that will help them in mathematical modeling (MP4). They don’t decide which model to use, but students have an opportunity to consider two different functions as models and to revise a function to fit a given data set.
Launch
Provide access to devices that can run Desmos or other graphing technology.
Design Principle(s): Maximize meta-awareness; Support sense-making
Student Facing
A certain brand of dog food gives the minimum daily amount of food a dog needs depending on its weight. We want to model the relationship between the amount of food and the dog’s weight with a function \(F\), where \(F(w)\) is the amount of food, in grams, needed by a dog weighing \(w\) pounds.
| weight (pounds) | food (grams) |
|---|---|
| 5 | 50 |
| 10 | 75 |
| 20 | 130 |
| 40 | 230 |
| 60 | 305 |
| 80 | 375 |
| 100 | 435 |
- Use graphing technology to find a linear function, \(F(w) = mw + b\), that fits the data.
- What aspects of the data does your function model well and what aspects does it not model well?
- The graph of \(f(w) = w^{\frac23}\) has a general shape that fits the data. Use graphing technology to find a scale factor \(k\) so that \(F(w) = kf(w)\) fits the data.
Student Response
For access, consult one of our IM Certified Partners.
Student Facing
Are you ready for more?
- How do the graphs of \(a(w) = 42w^{\frac{1}{2}}\), \(b(w) = 20w^{\frac{2}{3}}\), and \(c(w) = 14w^{\frac{3}{4}}\) compare?
- Which one do you think can be used to produce the best model of the amount of food needed? Explain your reasoning.
Student Response
For access, consult one of our IM Certified Partners.
Anticipated Misconceptions
If students are unsure how to start identifying an appropriate value for \(k\), suggest they try graphing a few different values (one large, one close to 0, and one negative, for example) and see which one seems closest, and then deciding how to revise their choice for \(k\) from there.
Activity Synthesis
The goal of this discussion is for students to understand that if we can recognize the general shape of data (or of an image, as in the previous activity), we can then identify a function type to model the data. Once the function type is known, we can use what we know about graphical transformations to fit a function to the data.
Here are some questions for discussion:
- “What is a reasonable domain for the function \(F\)?” (Adult dogs can weigh anywhere from a bit over a pound to almost 350 pounds, so \(1 \le x \le 350\) is a reasonable domain.)
- “How did you figure out an appropriate scale factor for \(k\)?” (I used the data point \((60,305)\). Since \(f(60) = 60^{\frac23} \approx 15\), and \(15 \boldcdot 20 = 300\), I graphed \(F(w) = 20w^{\frac23}\) and saw that it was a pretty good fit for the data set.)
- “What other types of functions might work to model this data?” (A quadratic might work with one of the zeros at 0.)
Supports accessibility for: Conceptual processing; Language
Lesson Synthesis
Lesson Synthesis
An important takeaway from this lesson is the effect of the scale factor on a function’s output. As a writing prompt, ask students to describe in their own words the effect of a scale factor \(k\) on the output of a function \(f\) if we consider \(y=k f(x)\). Give 2–3 minutes for students to write a response, and then select students to share their descriptions, displaying any graphs drawn for all to see that they used to help illustrate their ideas. If not brought up during the discussion, ask students what scale factor doesn’t change the outputs of a function to emphasize the difference between \(k\) values whose magnitude is greater than 1 and less than 1. Some students may notice the relationship between scale factors in this context and relate it to dilations and similar figures studied in geometry. If this happens, invite students to consider how the two things are the same and how they are different.
8.4: Cool-down - A Perfect Fit (5 minutes)
Cool-Down
For access, consult one of our IM Certified Partners.
Student Lesson Summary
Student Facing
Sometimes when we want to model data, we can look at the context and the shape of the data to help us figure out what type of function to use. Once we have the same general shape, we can translate a function up, down, left, or right or reflect a function to make it fit the data better. But sometimes these types of transformations are not enough.
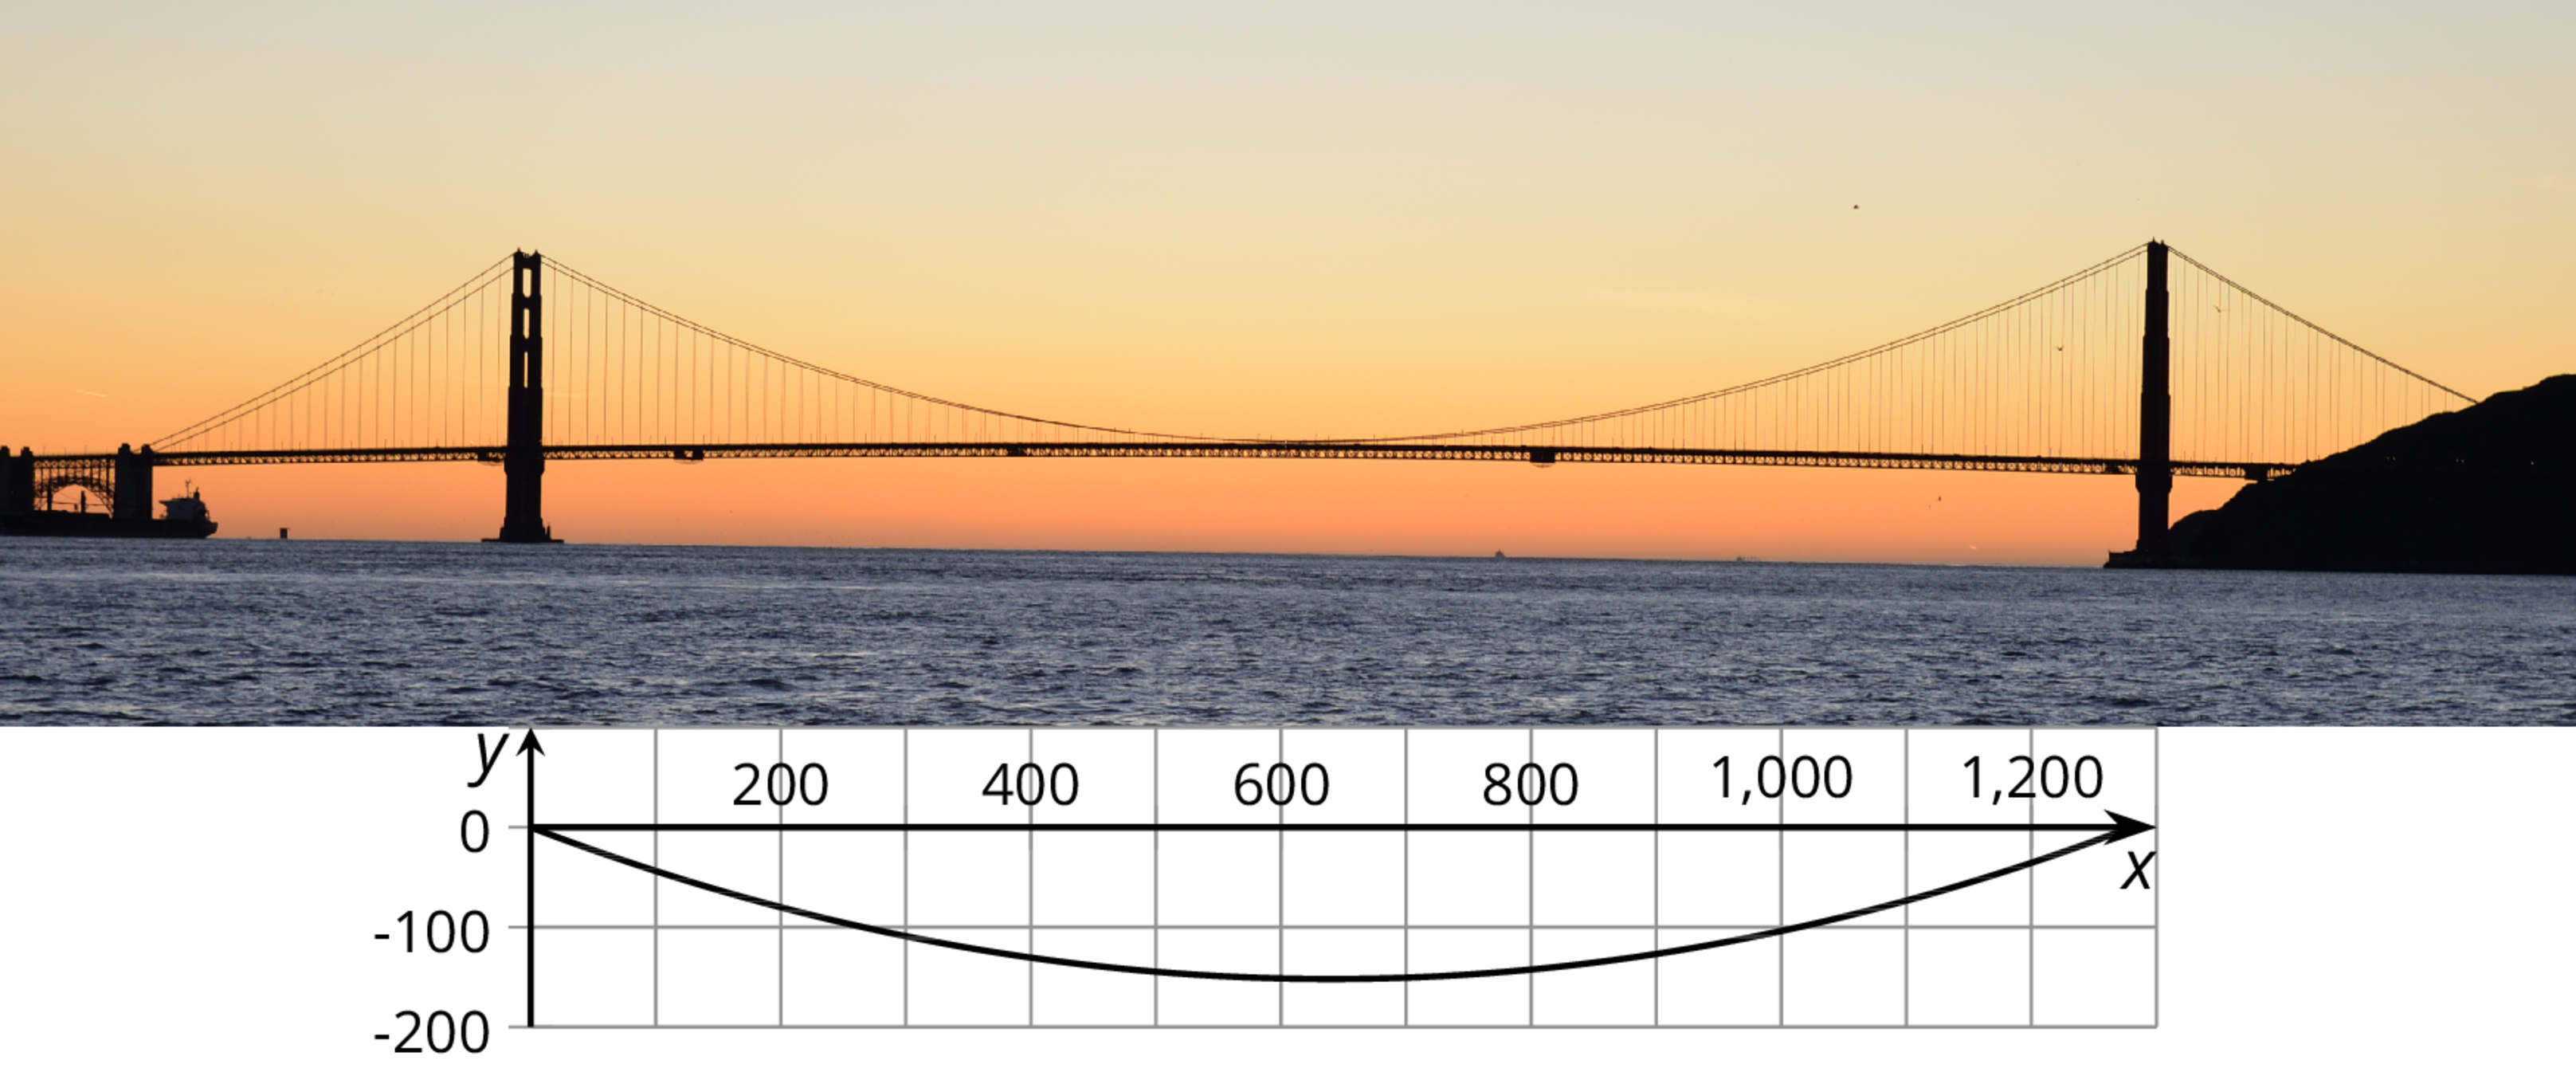
For example, the towers of the Golden Gate bridge in San Francisco are 1280 meters apart, and the tops of the towers are 152 meters above the roadway. If we place the \(x\)-axis at the top of the towers, we can model the parabolic shape representing the suspension cable between them using a quadratic function with zeros at 0 and 1280, given by \(f(x) = x(x-1280)\). Unfortunately, the model should have a value of -152 at \(x=640\), which is halfway between the towers, and instead we have
\(\displaystyle f(640) = 640(640-1280) = \text-640^2 = \text-409,\!600. \)
No number of translations or reflections of the current model will make a graph that matches the shape of the suspension cables and also keeps the zeros at 0 and 1280. So instead of adding to or subtracting from the output, we're going to multiply the output by a scale factor, \(k\). Using multiplication means we keep the zeros where they are while scaling all the other output values. To make -409,600 be -152, we are going to have to squash the graph using a very small scale factor. If we choose a scale factor \(k = \frac{152}{409,600} = 0.000371\), then the graph of \(y = kf(x) = 0.000371x(x-1280)\) has the same shape as the bridge.
Multiplying by a scale factor less than 1 squashes the graph vertically. This is also called compressing the graph vertically. Sometimes we want to stretch the graph. In that case, we would use a scale factor greater than 1.