Lesson 4
Tables of Relative Frequencies
- Let’s use tables to organize probabilities.
4.1: Notice and Wonder: Dog City

This two-way table summarizes data from a survey of 200 people who reported their home environment (urban or rural) and pet preference (dog or cat).
| urban | rural | total | |
|---|---|---|---|
| cat | 54 | 42 | 96 |
| dog | 80 | 24 | 104 |
| total | 134 | 66 | 200 |
What do you notice? What do you wonder?
4.2: Rolling into Tables
Decide which person will be partner A and which will be partner B.
The result of partner A’s roll is represented by the values on the left side of the table. The result of partner B’s roll is represented by the values on the top of the table.
Use the number generator to roll and record the result. For example, if partner A rolls a 3 and partner B rolls a 5, then record 3,5. Repeat this process until your teacher tells you to stop.
Use the table to summarize the results. For example, if 6,6 appears on your list a total of five times, write a 5 in the bottom right cell of the table.
| 1 | 2 | 3 | 4 | 5 | 6 | |
|---|---|---|---|---|---|---|
| 1 | ||||||
| 2 | ||||||
| 3 | ||||||
| 4 | ||||||
| 5 | ||||||
| 6 |
- Do the values in the table match your expectation? Explain your reasoning.
- Based on the table, how many times did partner A roll a 5?
- How many times did you both roll the same number?
- What percentage of the rolls resulted in the same number from both partners?
- What percentage of the rolls resulted in partner A rolling a 3 and partner B rolling a 6?
- Based on the table, estimate the probability that partner A will roll a 2 and partner B will roll a 4. Explain your reasoning.
4.3: Traveling Methods
-
A company has an office in Austin, Texas, and an office in Copenhagen, Denmark. The company wants to know how employees get to work, so they take a survey of all the employees and summarize the results in a table.
walk car public transit bike total Austin 63 376 125 63 627 Copenhagen 48 67 95 267 477 total 111 443 220 330 1,104 -
If an employee is selected at random, what is the probability that they work in Austin and drive a car to work?
-
If an employee is selected at random, what is the probability that they work in Copenhagen and ride a bike to work?
-
If an employee is selected at random, what is the probability that they take public transit to work?
-
If an employee from Copenhagen is selected at random, what is the probability that they ride a bike to work?
-
If an employee who takes public transit to work is selected at random, what is the probability they work in Austin?
-
How are the last two questions different from the first three?
-
-
A school district is interested in how students get to school, so they survey their high school students to see how they get to school and separate the numbers by grade level. The results of the survey are summarized in the table.
car bus other method total grade 9 1,141 3,196 228 4,565 grade 10 1,126 1,770 322 3,218 grade 11 1,732 799 133 2,664 grade 12 1,676 447 111 2,234 total 5,675 6,212 794 12,681 -
If a high school student is selected at random, what is the probability they are in grade 9 and ride the bus to school?
-
If a high school student is selected at random, what is the probability that they are in grade 12?
-
If a high school student is selected at random, what is the probability that they take a car to school?
-
If a grade 10 student is selected at random, what is the probability that they ride a bus to school?
-
If a grade 12 student is selected at random, what is the probability that they ride a bus to school?
-
If a student who rides the bus to school is selected at random, what is the probability that they are in grade 9?
-
Clare surveyed 40 students at her school as part of a psychology project. Here are the two questions she asked:
- Do you like to swim? (Yes or No)
- What is your favorite season? (Winter, Spring, Summer, or Fall)
Here are the results of her survey.
|
likes to swim |
does not like to swim |
|
|
winter |
5 |
4 |
|
spring |
8 |
3 |
|
summer |
11 |
1 |
|
fall |
4 |
4 |
- Create a relative frequency table for Clare’s data.
- If a student that took Clare’s survey is selected at random, what is the probability that they said they like to swim and their favorite season is summer?
- Create two of your own survey questions or use Clare’s questions to survey 20 or more people. Record your survey questions and display the results in a table.
-
Create a relative frequency table for your own data. What is the most common response to your survey? What is the least common response to your survey?
Summary
Tables provide a useful structure for organizing data. When several responses have been collected about some categorical variables, the data can be organized into a frequency table. The table can be used to calculate relative frequencies, which can be interpreted as probabilities.
For example, 243 participants in a survey responded to questions about their favorite season and whether they like wearing pants or shorts better. The results are summarized in the table.
| pants | shorts | |
|---|---|---|
| winter | 21 | 16 |
| spring | 43 | 20 |
| summer | 18 | 56 |
| autumn | 40 | 29 |
This table can be turned into a relative frequency table by dividing each of the values in the cells by the total number of participants.
| pants | shorts | |
|---|---|---|
| winter | 0.09 | 0.07 |
| spring | 0.18 | 0.08 |
| summer | 0.07 | 0.23 |
| autumn | 0.16 | 0.12 |
If a person is randomly selected from among these 243 participants, we can see that the probability that the chosen person’s favorite season is spring and likes shorts better than pants is 0.08. We can also use the fact that there were 63 people who listed spring as their favorite season (\(43+20\)), so the probability that a randomly selected person from this group likes spring best is around 0.26 (\(\frac{63}{243} \approx 0.26\)).
Glossary Entries
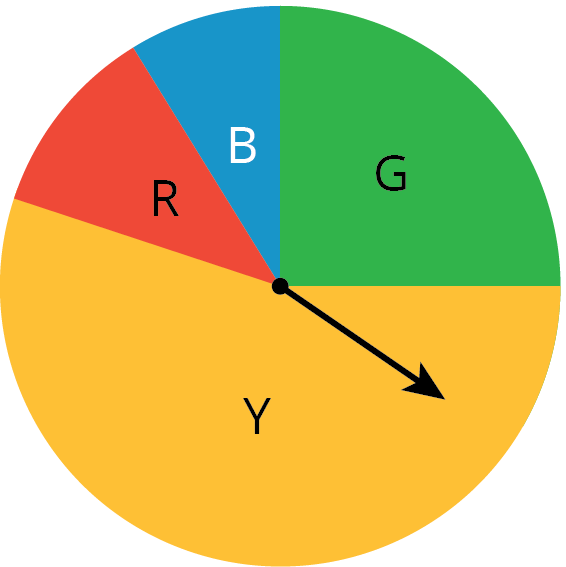
- chance experiment
A chance experiment is something you can do over and over again, and you don’t know what will happen each time.
For example, each time you spin the spinner, it could land on red, yellow, blue, or green.
- event
An event is a set of one or more outcomes in a chance experiment. For example, if we roll a number cube, there are six possible outcomes.
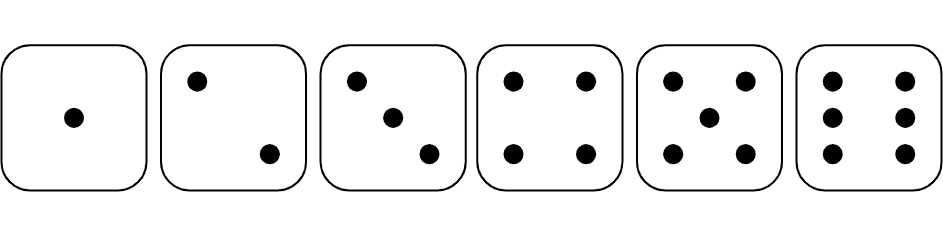
Examples of events are “rolling a number less than 3,” “rolling an even number,” or “rolling a 5.”
- outcome
An outcome of a chance experiment is one of the things that can happen when you do the experiment. For example, the possible outcomes of tossing a coin are heads and tails.
- probability
The probability of a chance event is a number from 0 to 1 that expresses the likelihood of the event occurring, with 0 meaning it will never occur and 1 meaning it will always occur.
- sample space
The sample space is the list of every possible outcome for a chance experiment.
For example, the sample space for tossing two coins is:
heads-heads tails-heads heads-tails tails-tails